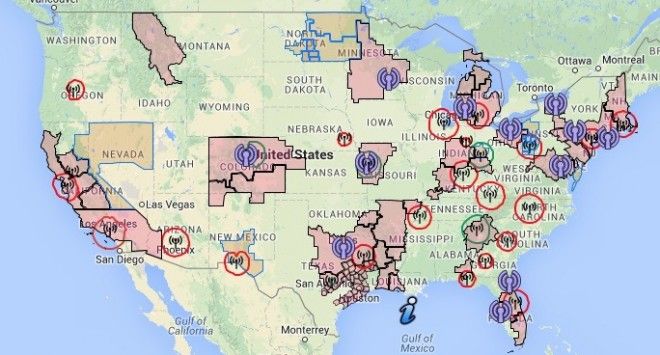
A few months back, we published a link to an awesome interactive map which shows up to date information on all T-Mobile’s 700MHz efforts. And, with the most recent developments, I felt it right to share again. A lot has changed, and continues to change as new spectrum acquisitions are applied for and new antennas are activated.
As you click on various markets and icons you get information specific to that area. For instance, the antennas with red circles around them are protected TV channel 51 locations, where 700MHz can’t be used by T-Mobile. Antennas with green circles show areas where an application to relocate the channel has been submitted. 700MHz can’t be used in these locations by T-Mobile until the relocation has been completed. Purple antennas show were potential antennas have been spotified, but are awaiting verification.
Markets colored pink are those where T-Mobile owns the spectrum, the orange/brown markets are where T-Mobile has applied to purchase spectrum, but the deal is still pending.
I’ve attempted to embed the interactive map below, but, if it doesn’t work, head on over to the original map and view it in full screen on browser, it’s pretty fantastic.
It goes without saying that some information may be inaccurate, but it’s the best look at T-Mo’s 700MHz dealings we’ll get until we get official announcements from the carrier.

