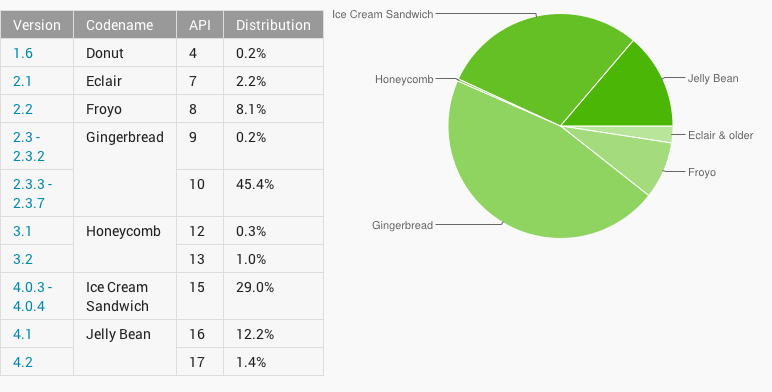
As expected at the beginning of every month, the Android Developers Dashboard has released the newest distribution chart showing each version of Android running as of Monday, February 4th, 2013. These numbers are determined based on the number of Android devices that access Google Play within a 14 day period ending on the data collection date, which is in this case yesterday, February 4th.
There is some good news as Android 4.0 and above continues to close in on the elusive 50% mark with a now 42.6% percentage of Android hardware. Unfortunately, Gingerbread continues to reign as the crown price of Android market share with 45.6%, a number we hope to see decline rapidly in the coming months. Jelly Bean, composed of Android 4.1 and 4.2 makes up 13.6% of devices, up from 10.2% last month. Ice Cream Sandwich dropped one-tenth of one percent from 29.1% to 29.0% from January into February.
As the graph below shows, Gingerbread continues to make a slow drop, a direct result of the increase in Jelly Bean updates and shipment. Still, let’s continue to hope that Gingerbread makes a sharp fall and is down into the single digits well before 2014, as those users deserve to know Jelly Bean. Of course by the time that happens, Key Lime Pie should be well on its way from stealing market share from Jelly Bean. Here’s to hoping.

