Google Releases October Distribution Chart For Android Version Breakdown
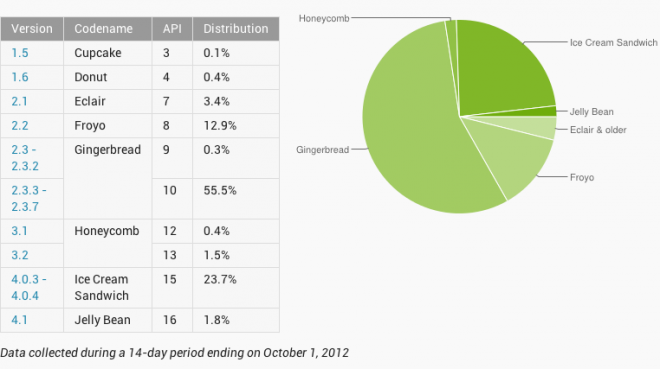
It’s a new month and with the start of every month comes a brand new chart from Google showing their version by version breakdown in the Android world. There is a small bit of good news for Ice Cream Sandwich devices with a jump from 22.1 percent to 23.7 percent of all Android devices. Not quite the monumental jump we’d like to see, but every increase is a good increase.
It won’t come as any surprise that Android 2.3 Gingerbread devices still control the lions share of the Android world with 55.8 percent of the market, though that’s down 1.7 month-over-month. We can only hope that this number diminishes as the months wear on so that Android users everywhere can see the significant differences between Gingerbread and Ice Cream Sandwich/Jelly Bean.
Speaking of Jelly Bean, it now sits at 1.8% of all Android devices though we expect the release of the Samsung Galaxy Note II and upcoming upgrades to the HTC One X/One S and Galaxy S III to bump that number up a bit in the coming months.
It’ll be interesting to see how these numbers change four months from now after the aforementioned Jelly Bean updates and holiday releases hit store shelves.

